Fear and Greed Index Explained: How to Use Market Sentiment
 Oct, 11 2026
You’ve probably seen that little gauge on the news or a trading app. It swings from red to green, labeled with words like "Extreme Fear" or "Extreme Greed." It looks scientific, but is it actually useful? Or is it just noise dressed up in a dashboard?
The Fear and Greed Index is a quantitative tool developed by CNN Business in 2012 that measures investor emotion on a scale from 0 to 100. Zero means everyone is panicking; 100 means everyone is euphoric. Fifty is neutral. It’s not a crystal ball. It doesn’t tell you when the stock market will crash next Tuesday. But it does tell you how people are feeling right now, which often tells you where prices might go next.
Why should you care? Because markets aren’t driven by logic alone. They’re driven by humans. And humans are emotional. When we get scared, we sell good assets at bad prices. When we get greedy, we buy junk at sky-high prices. This index helps you spot those moments so you can do the opposite of the herd. Let’s break down how it works, why it matters for both stocks and crypto, and how to use it without falling into common traps.
What Exactly Is the Fear and Greed Index?
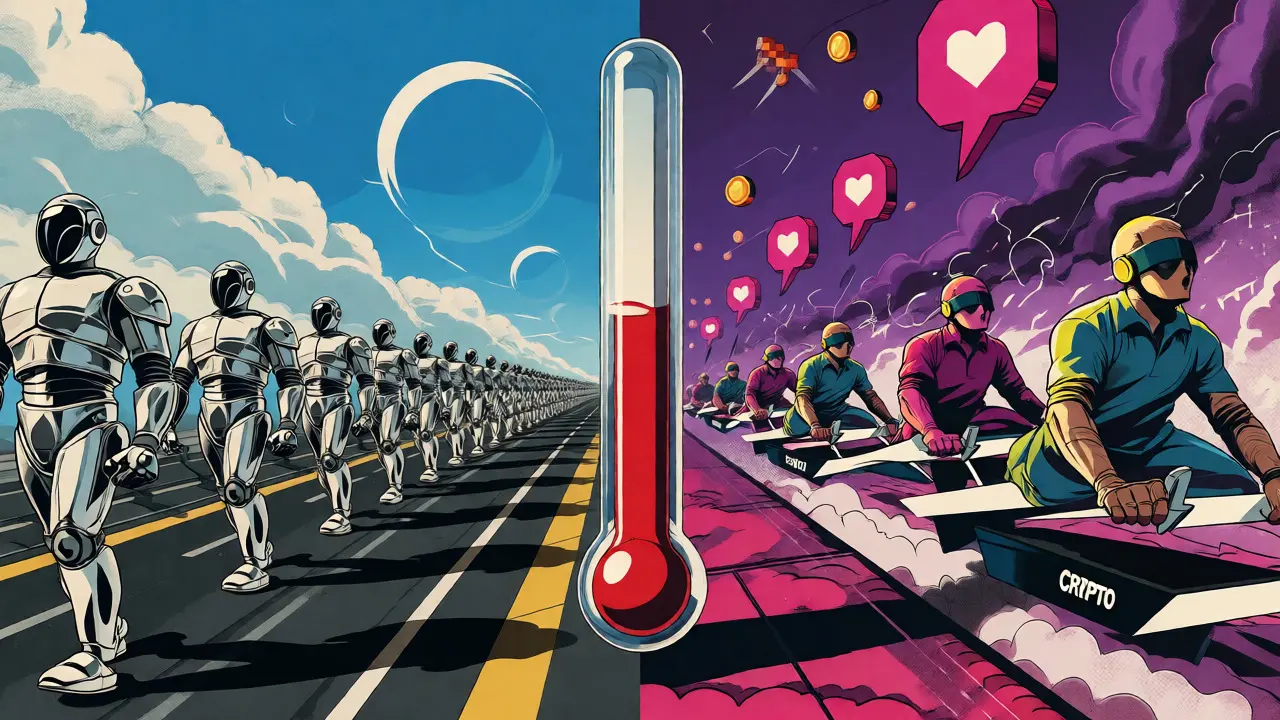
Think of the Fear and Greed Index as a thermometer for market psychology. Just as a thermometer tells you if your body temperature is too high or too low, this index tells you if the market is overheating (greed) or freezing over (fear). It was created because traditional financial analysis-looking at earnings reports and balance sheets-often misses the human element. You can have a great company with strong fundamentals, but if everyone is terrified, the stock price will drop anyway.
The index aggregates seven different data points into one single number. It’s updated daily during market hours. The goal isn’t to predict the future perfectly. As CNN explicitly states, it’s not a prediction tool. It’s a measurement tool. It shows you the current mood. If the mood is extreme, history suggests things usually revert to the mean. People stop being so scared, or they stop being so excited. That reversion is where the opportunity lies.
How Is It Calculated? The Seven Ingredients
You don’t need a PhD in math to understand this, but knowing the ingredients helps you trust the recipe. The index takes seven distinct indicators, normalizes them all to a 0-100 scale, and averages them out. Each component carries equal weight-about 14.3% each. Here’s what goes into the mix:
- Stock Price Momentum: This compares the S&P 500’s performance against its 125-day moving average. If the market is way above its average, that’s greed. Way below? Fear.
- Stock Price Strength: It counts how many stocks hit 52-week highs versus lows. A ratio of 3:1 in favor of highs signals greed. The reverse signals fear.
- Stock Price Breadth: This looks at volume. Are more shares rising than falling? If advancing volume massively outweighs declining volume, investors are rushing in (greed).
- Put and Call Options: Traders bet on direction using options. Puts are bets on drops; calls are bets on rises. A high put/call ratio means people are hedging against crashes (fear). A low ratio means they’re betting on gains (greed).
- Junk Bond Demand: High-yield corporate bonds are risky. When investors feel brave, they buy these, narrowing the yield spread compared to safe government bonds. That’s greed. When they flee to safety, spreads widen. That’s fear.
- Market Volatility: Measured by the VIX (the "fear index"). High VIX readings (above 30) indicate panic. Low readings (below 15) indicate complacency or greed.
- Safe Haven Demand: This tracks the difference between stock returns and Treasury bond returns over 20 days. If bonds are outperforming stocks significantly, people are hiding in cash-like safety. That’s fear.
By blending these, the index smooths out anomalies. One indicator might be wrong, but seven together give a clearer picture of collective behavior.
Crypto Fear and Greed: A Different Beast
If you’re into blockchain, you know the stock market version isn’t the only game in town. There’s also the Crypto Fear and Greed Index, created by alternative.me in 2018. Why a separate index? Because crypto moves differently. It’s more volatile, trades 24/7, and reacts heavily to social media hype rather than just earnings reports.
The crypto version uses four metrics instead of seven, weighted differently:
| Component | Stock Market FGI (CNN) | Crypto FGI (Alternative.me) |
|---|---|---|
| Volatility | VIX-based (Weight: ~14%) | Bitcoin volatility vs. 30/90 day avg (Weight: 25%) |
| Momentum | S&P 500 vs. Moving Average (Weight: ~14%) | Price momentum relative to historical trends (Weight: 25%) |
| Social Media | Not included | Twitter/Reddit sentiment analysis (Weight: 15%) |
| Dominance | Not included | Bitcoin dominance changes (Weight: 10%) |
| Options/Bonds | Puts/Calls, Junk Bonds, Safe Havens | Not included |
The crypto index is faster to react because it includes social sentiment. In crypto, a tweet from an influencer can move markets in minutes. Traditional finance relies more on institutional flows and bond yields, which change slower. If you trade Bitcoin, Ethereum, or Solana, use the crypto-specific index. Using the stock index for Bitcoin is like using a map of London to navigate Tokyo. Similar concepts, totally different terrain.
Using the Index: Contrarian Strategies That Work
So, you see the number. It’s at 15. Now what? The core strategy here is contrarianism. Warren Buffett famously said, "Be fearful when others are greedy, and greedy when others are fearful." This index quantifies that advice.
Extreme Fear (0-25): When the index hits these levels, panic selling has likely run its course. Historically, buying during extreme fear has yielded positive returns over the next 6-12 months. For example, during the March 2020 pandemic crash, the index hit an all-time low of 2. Those who bought then saw massive gains as markets recovered. Don’t try to time the exact bottom. Instead, view extreme fear as a signal to start accumulating quality assets gradually.
Extreme Greed (75-100): When everyone feels invincible, caution is wise. Prices may be inflated beyond fundamentals. Selling some positions or tightening stop-losses makes sense. However, beware: markets can stay irrational longer than you can stay solvent. An index reading of 90 doesn’t guarantee a crash tomorrow. It just means risk is elevated. In December 2021, the index hit 85+. Many sold, missing further upside, but those who held through the subsequent correction protected their capital better.
Neutral Zone (25-75): This is the "noise" zone. The index offers little actionable insight here. Markets are balanced. Focus on fundamental analysis or technical setups rather than sentiment extremes.
Common Mistakes to Avoid
Even smart investors mess this up. Here’s what goes wrong most often:
- Treating it as a standalone signal: Never buy or sell solely because the index says so. Always combine it with other tools. Check valuations, news catalysts, and technical support levels. The index confirms sentiment; it doesn’t replace analysis.
- Ignoring the trend: In a strong bull market, the index can stay in "Greed" territory for weeks. Selling every time it hits 75 might cause you to miss significant gains. Look for divergence-when prices make new highs but the index fails to reach new highs, that’s a stronger warning sign.
- Confusing short-term noise with regime shifts: A sudden drop to 20 might be a temporary dip, not a crash. Context matters. Was there a specific news event? Or is it broad-based weakness? Investigate before acting.
- Applying stock logic to crypto blindly: Crypto cycles are shorter and more violent. A "neutral" reading in stocks might be "extreme fear" in crypto due to higher baseline volatility. Always use the correct variant.

Limitations and Criticisms
No tool is perfect. Critics, including Nobel laureate Robert Shiller, argue that sentiment indicators capture fleeting emotions but ignore long-term valuation metrics. If a stock is fundamentally overpriced, even extreme fear won’t save it from eventual decline. The index assumes mean reversion, but sometimes bubbles persist for years.
Another issue is methodology rigidity. The calculation hasn’t changed much since 2012. With algorithmic trading now accounting for over 60% of NYSE volume, traditional retail-driven patterns may be shifting. Some experts worry the index is becoming less predictive as more people watch it, creating self-fulfilling prophecies. If everyone buys at 20, the bounce happens instantly, leaving latecomers behind.
Finally, it lacks timing precision. It tells you the environment is hostile or friendly, but not exactly when conditions will change. You could sit in "Extreme Fear" for three months before the market turns. Patience is required.
Practical Tips for Investors
Ready to use this? Here’s a simple workflow:
- Check Daily: Glance at the index once a day. Don’t obsess over hourly fluctuations.
- Set Alerts: Configure notifications for readings below 25 and above 75. This saves mental energy.
- Combine with Fundamentals: If the index is at 10, ask: "Is this asset cheap based on earnings or utility?" If yes, consider buying. If no, wait.
- Diversify Your View: Watch both the stock and crypto indices. Sometimes they diverge, offering arbitrage-like opportunities in portfolio allocation.
- Journal Your Decisions: Note what the index said when you made key trades. Over time, you’ll learn if it actually helps your personal strategy.
Remember, the goal isn’t to beat the market every day. It’s to avoid catastrophic mistakes driven by emotion. By externalizing your feelings into a number, you regain control. You stop reacting and start planning.
Is the Fear and Greed Index accurate?
It is accurate in measuring current sentiment, but not in predicting future prices with certainty. Historical data shows that extreme readings often precede reversals, but the timing varies. It works best as a confirmation tool alongside other analyses.
Can I use the stock Fear and Greed Index for Bitcoin?
No. Bitcoin has different drivers, such as social media hype and 24/7 trading. Use the Crypto Fear and Greed Index provided by alternative.me, which accounts for cryptocurrency-specific volatility and dominance metrics.
What does a reading of 50 mean?
A reading of 50 indicates neutral sentiment. Investors are neither overly optimistic nor pessimistic. This is typically a stable period where fundamental factors drive price movements rather than emotional extremes.
Does the index work for day trading?
Generally, no. The index updates daily and reflects broader market psychology. Day traders rely on minute-by-minute price action and order flow. The index is better suited for swing trading or long-term investing decisions.
Why did the index hit 2 in March 2020?
The global pandemic caused unprecedented uncertainty, leading to mass sell-offs across all asset classes. Investors fled to cash and gold, causing extreme fear readings. It marked a historic low point before the subsequent recovery.